Average Black Friday Discount on Shopify: 17% to 37%
Named sources put the 2025 Black Friday discount at 17% to 37%. Why they disagree, which fits your Shopify store, and how to read a rival's real cut.
Thomas Pham · · 8 min read
There is no one average Black Friday discount. For the same 2025 season, named public sources put it anywhere from 17% to 37%, because each one measures different stores and a different kind of "average". For a Shopify store selling direct, the closest figures sit around 25–26%. Your own rivals' price history beats all of them.
Black Friday 2026 falls on Friday 27 November and Cyber Monday on Monday 30 November (Thanksgiving is the fourth Thursday in November). If you are about to pick your own number, the worry is usually the same: everyone seems to be going 30% off, so should you? The sources below say "everyone" is several different groups of stores.
What is the average Black Friday discount?
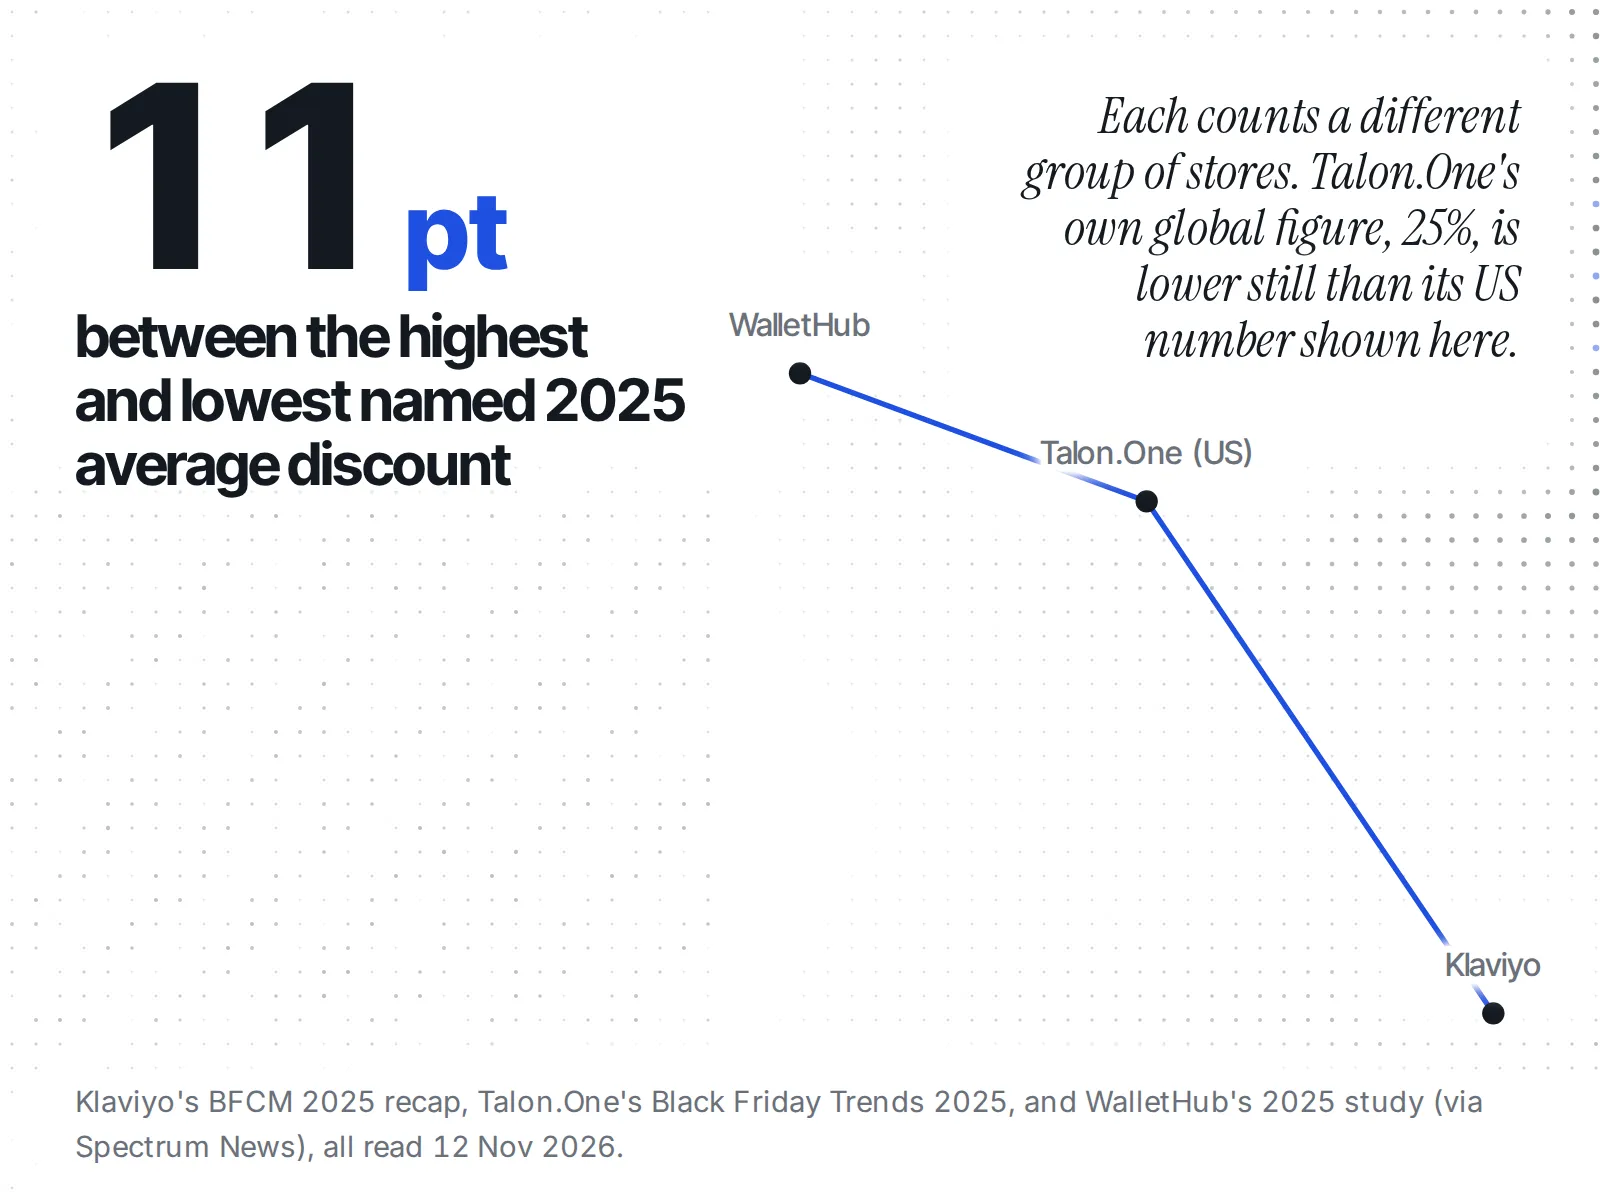
The published 2025 averages run from 17% to 37%. Klaviyo's merchant base averaged 26.2% across BFCM. Talon.One's brands averaged 25% globally and 35% in the US. WalletHub's 13 big US retailers averaged 37.2%. Adobe's Cyber Monday 2025 release put category peaks between 17% and 31%.
Here they are side by side, with what each one actually counted:
| Source | 2025 figure | What it measured | Whose stores |
|---|---|---|---|
| Klaviyo BFCM recap | 26.2% (29.6% in 2024) | Average discount across the season | Klaviyo's own merchants, mostly email- and SMS-led ecommerce brands |
| Talon.One Black Friday Trends 2025 | 25% global, 35% US (21% global in 2024) | Average discount | About 300 brands on its promotion platform |
| Adobe Cyber Monday 2025 | 17% (sporting goods) to 31% (electronics) | Peak percent off listed price, by category | Split by product category, not by store |
| WalletHub 2025 study (via Spectrum News) | 37.2% | Average discount across about 3,100 deals | 13 major US retailers, highest JCPenney (74.1%) |
| Salesforce Cyber Week 2025 results | No discount rate published | Average selling price, up 6% year on year | Global Cyber Week shopping |
WalletHub's own site refused our fetch, so its figure here comes through a news republication of the same release dated 24 November 2025.
Why do the sources disagree so much?
Black Friday discount sources disagree because they count different things. WalletHub counts deals at big-box retailers, where one store averaged 74.1%. Klaviyo and Talon.One average across the brands on their own platforms. Adobe reports the peak cut per category. Salesforce stopped reporting a rate at all in its results.
Three differences do most of the work:
- Whose stores. A national department-store chain is a different business from a 20-product Shopify brand. Among WalletHub's 13 retailers, JCPenney alone averaged 74.1%. Klaviyo's base is closer to a Shopify store selling direct.
- What kind of average. Adobe gives a peak percent off listed price for each category. Klaviyo and Talon.One give one figure across their whole base. A peak and an average of everything are different numbers, even from the same data.
- Forecast or result. Adobe's 2026 numbers and Salesforce's November 2025 predictions are forecasts. Klaviyo, Talon.One, WalletHub and Adobe's December 2025 release are results. Quoting a forecast as last year's average is an easy slip to make.
None of these figures is an audited census. Each is one company's read of its own data.
Does the average discount change by category?
Black Friday discounts vary more by category than from year to year. Adobe's 2026 forecast puts the peak at 30% for electronics, 29% for toys, 23% for apparel and 18% for furniture. Each is within about a point of 2025. Your category tells you more than any all-store average.
Adobe's 2026 holiday forecast, released on 28 September 2026, expects discounts "on par with the 2025 season". This is a forecast, not a result:
| Category | 2026 forecast peak | 2025 peak (Adobe) |
|---|---|---|
| Electronics | 30% | 30.1% |
| Toys | 29% | 28% |
| TVs | 23% | 24.2% |
| Computers | 23% | 22.8% |
| Apparel | 23% | 23.2% |
| Sporting goods | 19% | 19.5% |
| Appliances | 18% | 19.2% |
| Furniture | 18% | 19% |
Adobe's two releases give slightly different 2025 peaks (apparel is 25% in the Cyber Monday release and 23.2% here), so read each as a rough figure, not a precise one.
Salesforce's 2025 Cyber Week forecast expected deeper cuts in a few categories: 37% for general apparel and 35% for health and beauty in the US, and 40% for beauty and makeup globally. That was a prediction made on 20 November 2025, and Salesforce's results release did not report a discount rate to check it against.
Which day has the deepest discount?
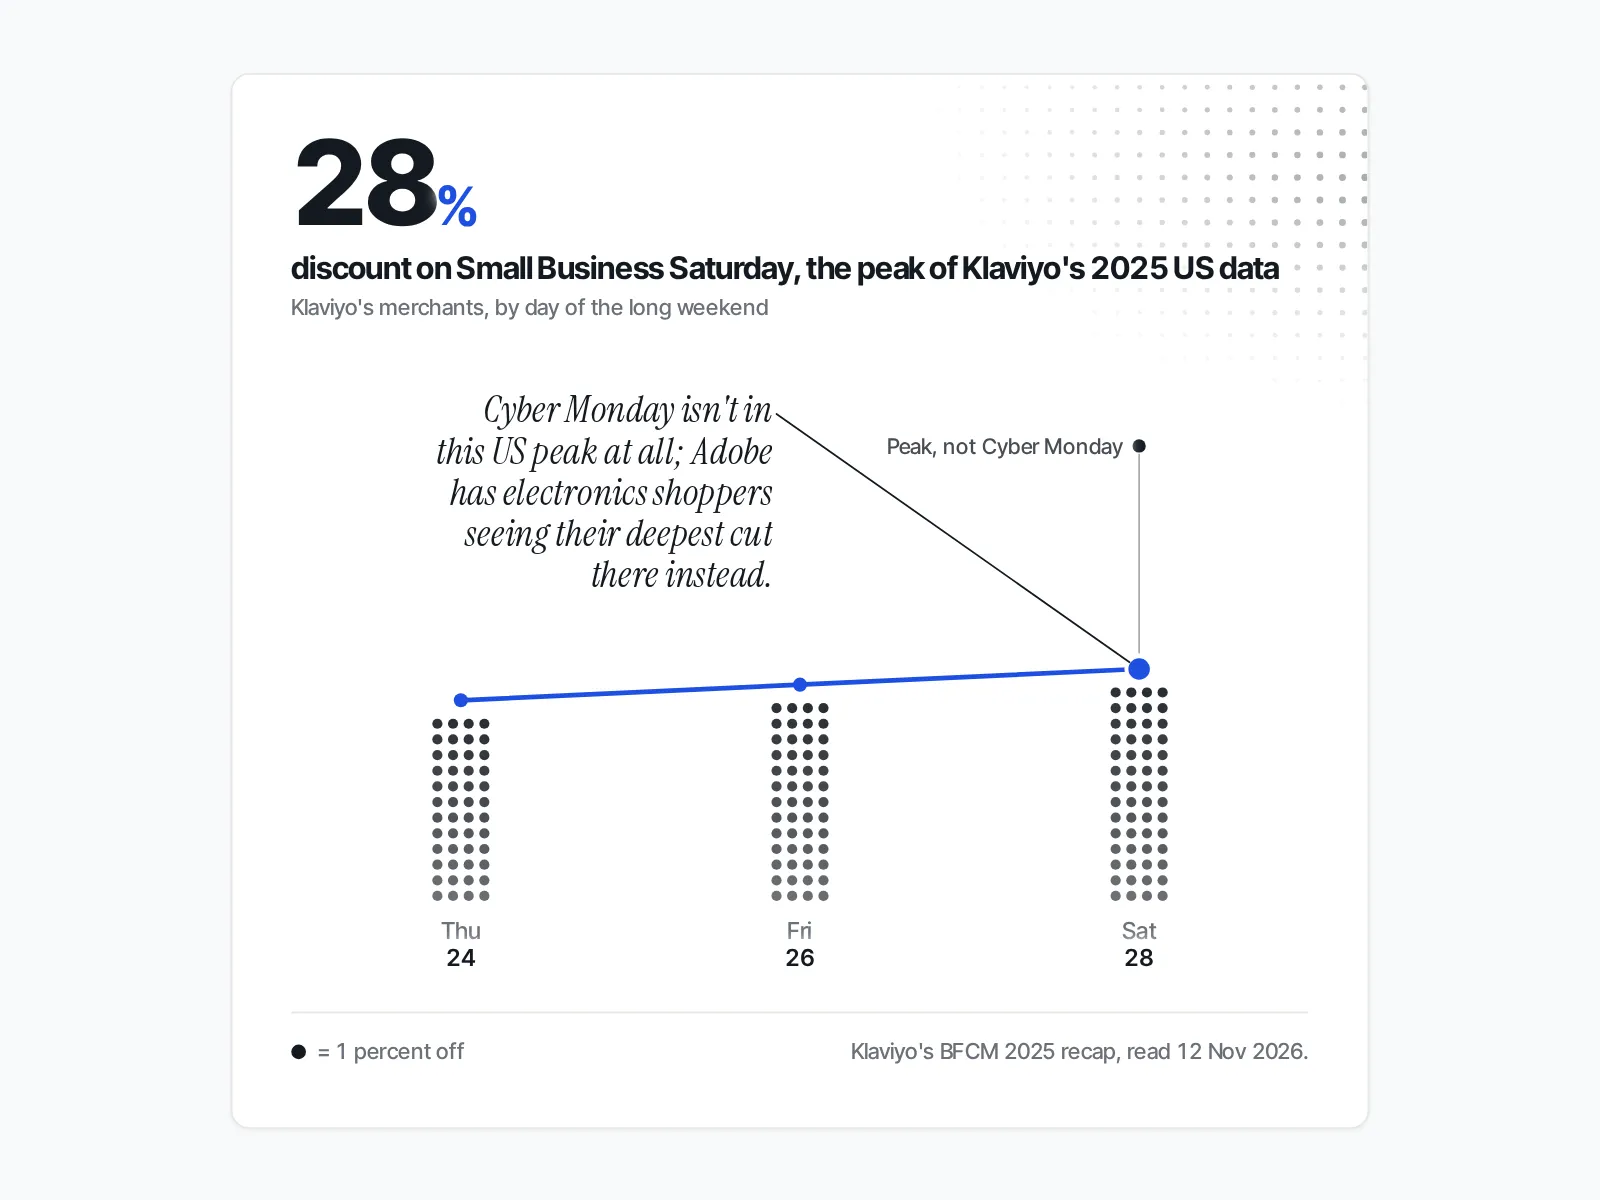
The day with the deepest discount depends on the category and the source. Adobe expects electronics and computers to be deepest on Cyber Monday, sporting goods on Thanksgiving, and TVs, toys, apparel, appliances and furniture on Black Friday. In Klaviyo's US data, the peak was Small Business Saturday at about 28%.
Klaviyo's 2025 recap puts US discounts at roughly 24% on Thanksgiving and 26% on Black Friday, rising to about 28% on Small Business Saturday. So if you sell apparel, a rival's Black Friday price is the one to watch first. If you sell electronics, the bigger move may come three days later on Monday 30 November.
Is the average discount going up or down?
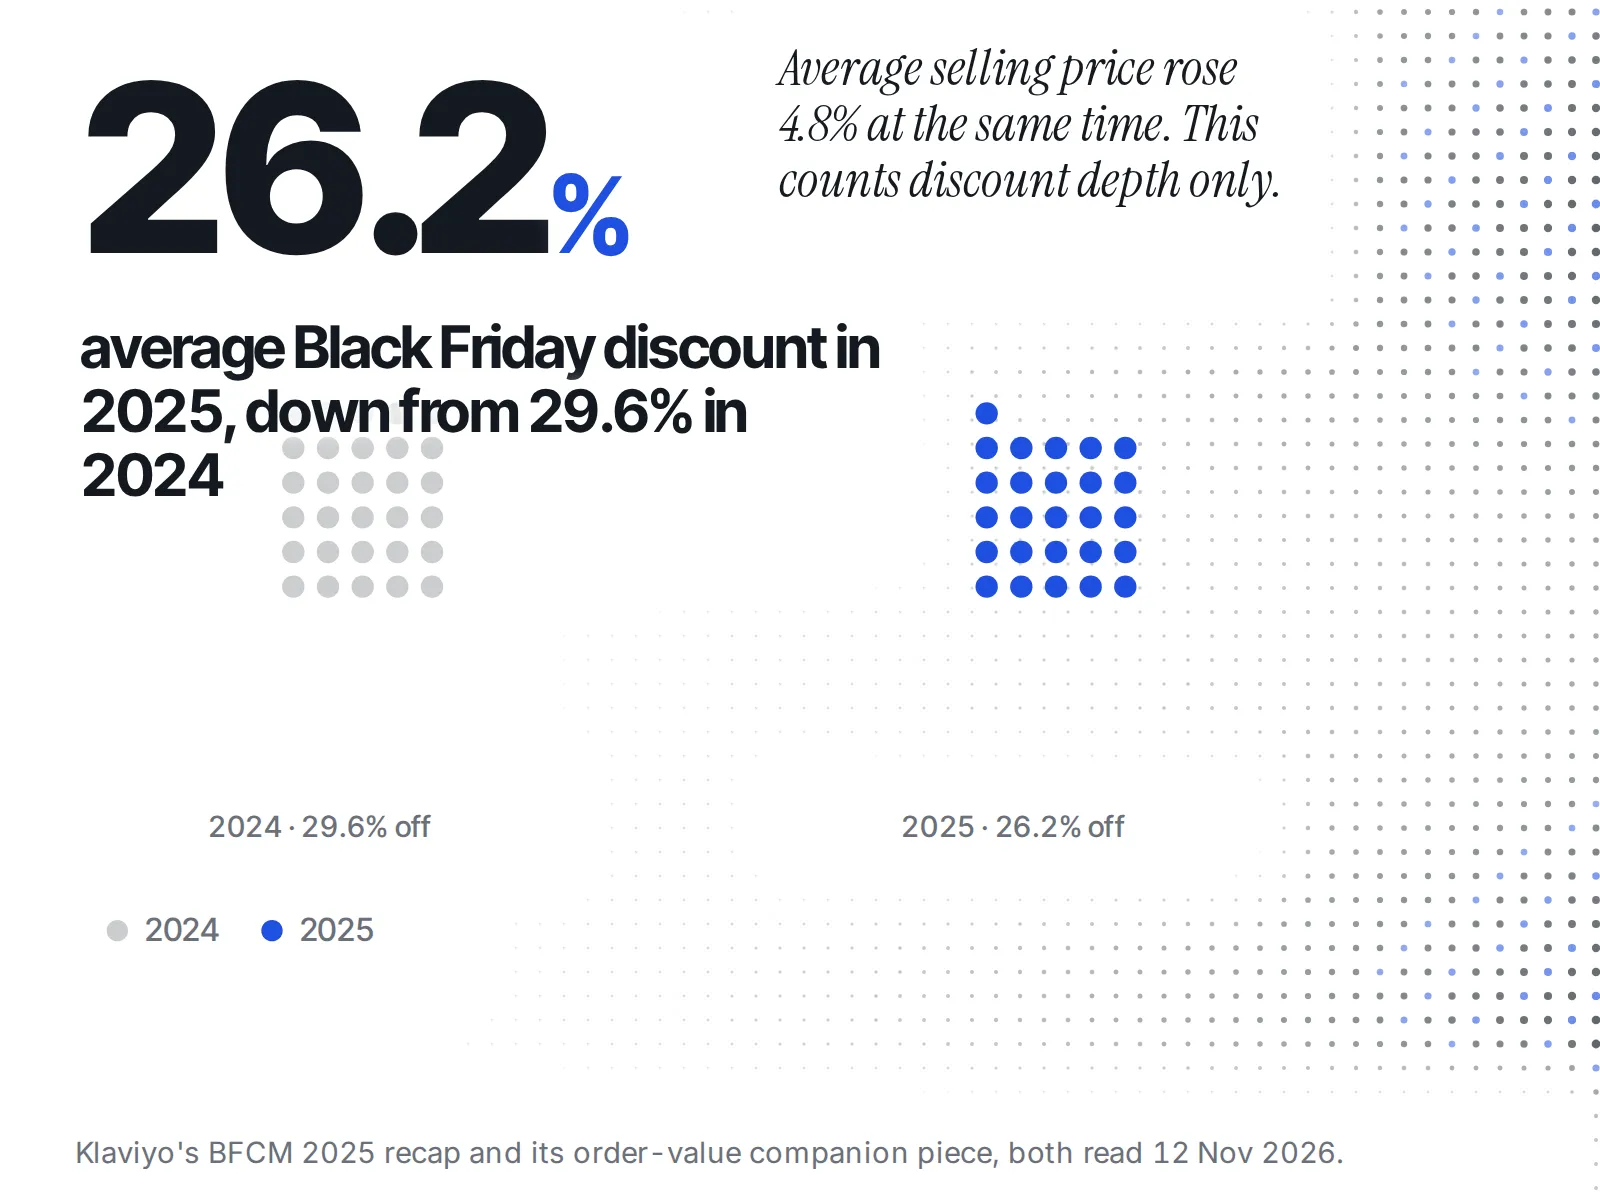
Both, depending on whose stores you count. Klaviyo's merchants cut less in 2025: 26.2% against 29.6% in 2024, a drop of nearly 10%. Talon.One's brands cut more: 25% against 21% globally. The two are not in conflict. They describe different groups of stores.
The more useful line in Klaviyo's recap is about results. Its brands that offered the smallest discounts saw some of the healthiest sales growth. Klaviyo's companion piece on order value adds that average selling price rose 4.8% over the season while discounts fell. Salesforce saw the same direction, with average selling price up 6% across Cyber Week. Deeper was not what the growing brands did.
Which number is closest to a store like yours?
If you run a Shopify brand selling direct, start from Klaviyo's 26.2% and Talon.One's 25%: both average across brands, not big-box chains. Then adjust with Adobe's figure for your category. WalletHub's 37.2% describes 13 large retailers and is the wrong anchor for most independent stores.
A benchmark that does not match your store pushes you in the wrong direction. Anchor on 37% when your category peaks nearer 19%, and you hand over margin nobody asked for. Anchor on an all-store average when your rivals all sell toys, and you may look timid next to them.
How do you see what a rival is really discounting?
Read the rival's price history, not their banner. On Shopify, a sale shows when the "Compare-at price" is higher than the "Price". The percentage on the banner comes from whatever compare-at the merchant typed in. Nothing in that field checks it was ever the real price.
Shopify's Help Center page on sale pricing tells merchants to set the Compare-at price field "to the original price", and notes that "Using sale prices is different from setting up discounts". Our explainer on what the compare-at price is covers the mechanic in full.
The rules on what a "was" price should be are stricter than the field. In the US, the FTC's guide says a former price must be "the actual, bona fide price at which the article was offered to the public on a regular basis for a reasonably substantial period of time" (16 CFR 233.1). In the UK, the ASA says it "expects advertisers to provide at least three months of pricing history" behind a savings claim.
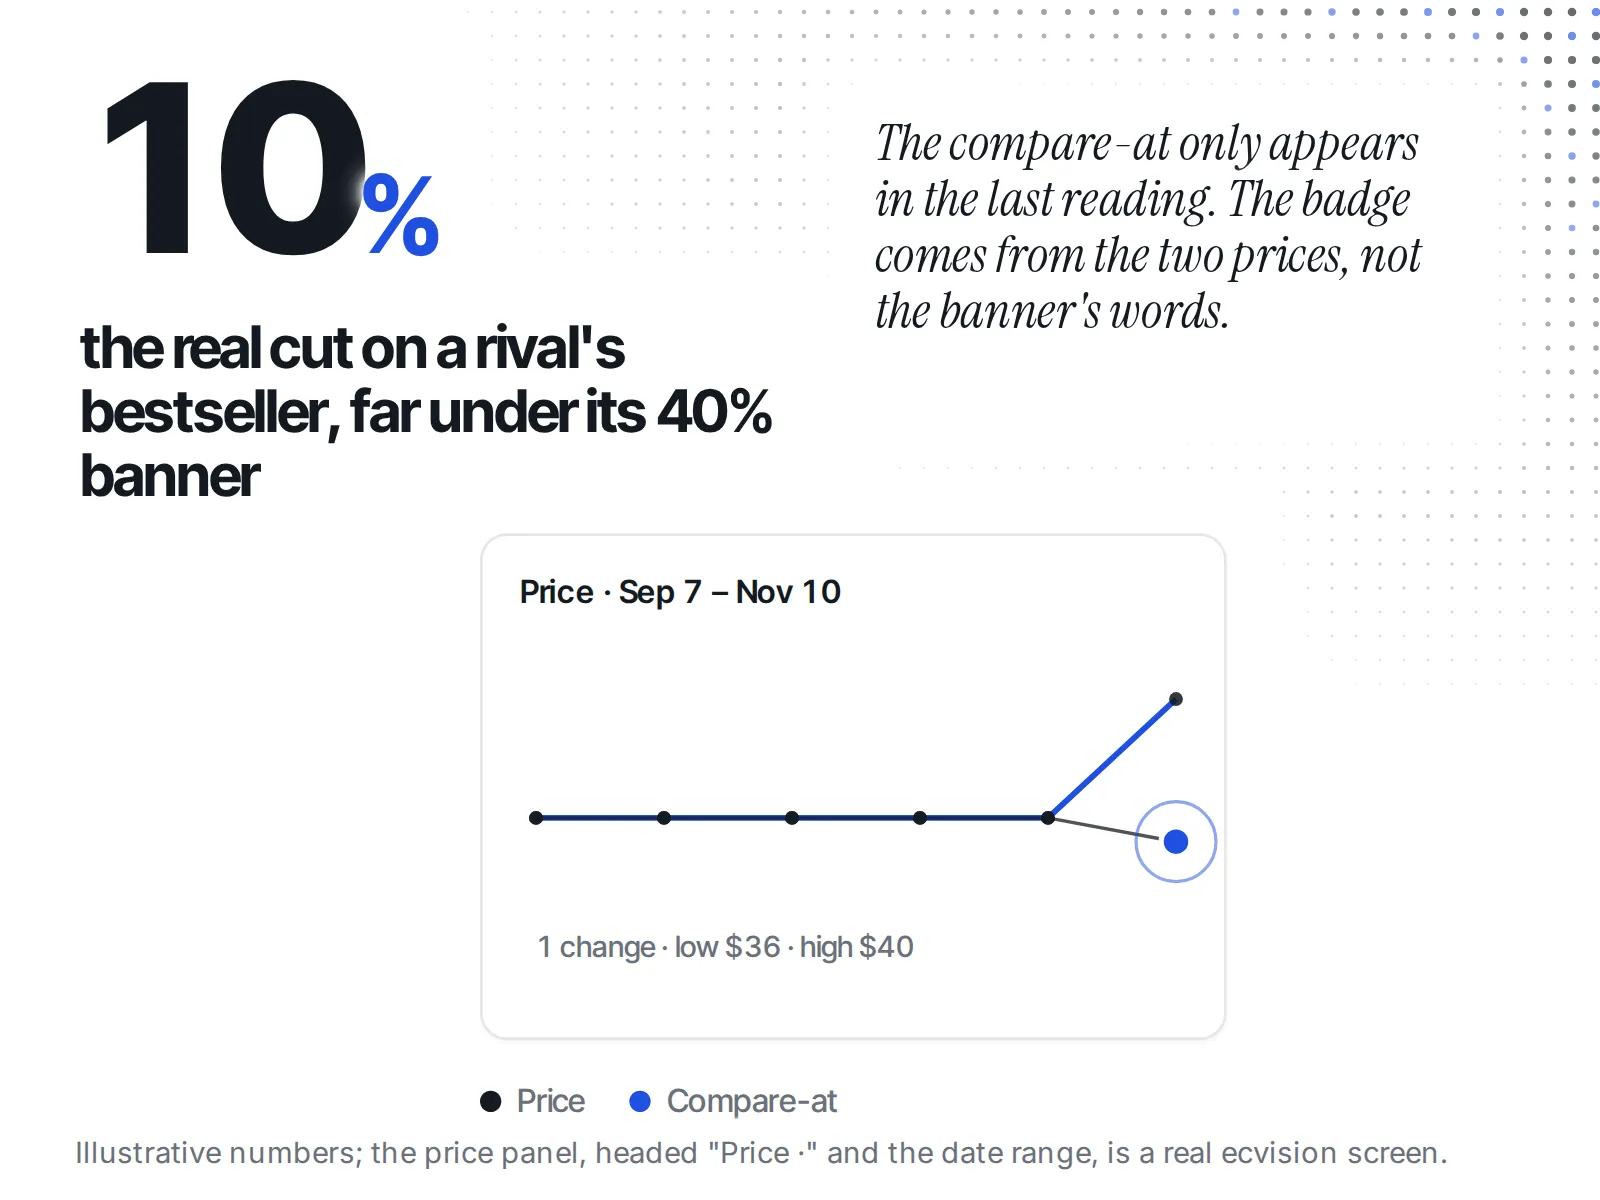
Here is one hypothetical example. Say you sell candles, and a rival's best-seller has sat at $40 all autumn. In mid-November they set the compare-at to $60 and the price to $36. The banner says 40% off. Against the price they actually charged, the cut is 10%. If you had matched "40% off" from the banner, you would have cut four times deeper than they did.
So the method is simple:
- Pick the three to five rival products that compete with your best-sellers.
- Note each one's price and compare-at now, before the sale starts.
- Check them again on Black Friday and on Cyber Monday.
- Work out the cut against the price they were charging before, not against the compare-at.
Our post on building a rival discount calendar shows how to log this over the whole season.
How do you track a rival's real discount without checking by hand?
ecvision records each tracked rival product's price and compare-at over time. In the Sales Intelligence tab, the price panel shows the discount as a badge, worked out from the product's own price against its own compare-at. A line under the chart counts how many times the price changed, with the low and the high.
The panel's heading reads "Price ·" followed by the date window it covers. When the compare-at sits above the price, the panel shows a discount badge. That percentage is calculated from the two prices, not copied from the rival's banner. Under the chart, a product whose price never moved reads "flat across" its number of readings, then "on sale" or "no discount". One that did move reads its count of changes, then "low" and "high". That line answers the candle example: if the low over the autumn was $40 and the compare-at only appeared in November, the 40% badge tells you less than the change count does.
You can see what each plan covers on the pricing page.
When does a deeper discount become a margin trap?
When it no longer clears your margin after returns. If matching a rival's cut leaves you losing money on each order that comes back, the benchmark has stopped helping you. Klaviyo's lightest discounters grew fastest in 2025, so holding is a real option.
Working out where that line sits for your store is its own job. Our guide to what to do when a competitor cuts prices walks through it, with versions for clothing brands and home goods. For the wider season numbers, spend and traffic rather than discount depth, see our BFCM statistics for 2026.
Your Black Friday discount checklist
- Ignore any single "average" until you know whose stores it counts.
- If you sell direct, start near Klaviyo's 26.2% and Talon.One's 25%, then check Adobe's figure for your category.
- Know which day your category usually cuts deepest.
- Write down your rivals' current price and compare-at before 27 November.
- Measure their cut against the price they actually charged, not their banner.
- Stop where the discount no longer clears your margin after returns.