 Scaling
7copies of this creative+2 in 14 days
Their ads, catalogue, social and traffic. Ask your Claude or ChatGPT; every figure comes back dated.
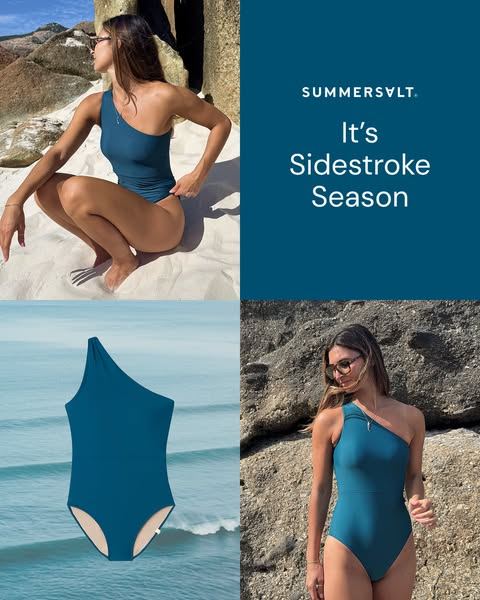
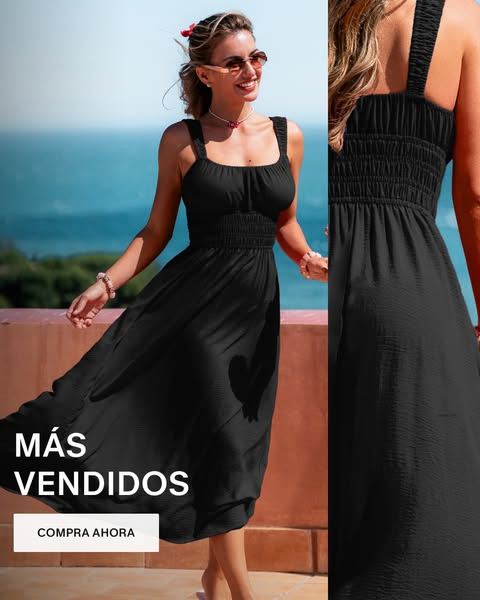
 #1 · Swim Top
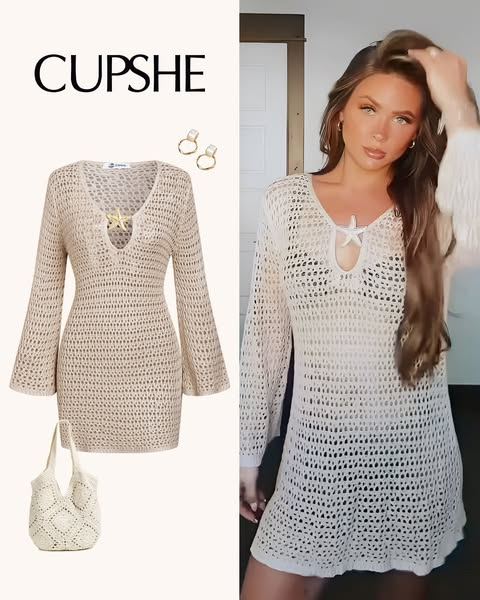
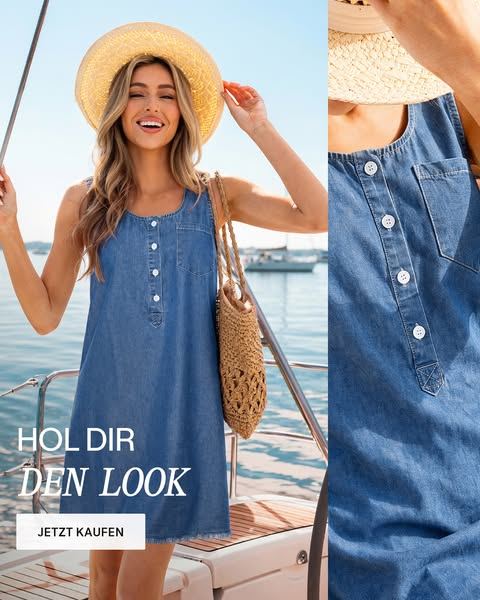
 #2 · Dress
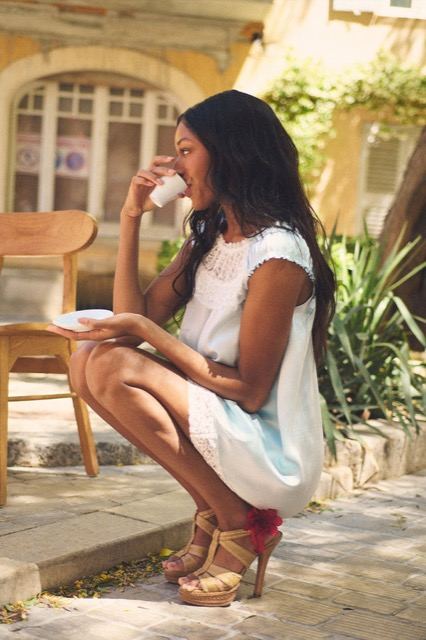 #3 · DressScaling
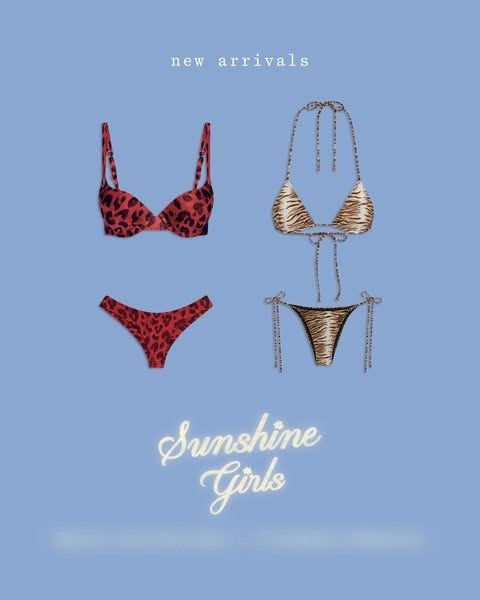
Scaling = a creative at least 14 days old that got ≥ 2 new copies in the last 14 days. What they did, not how it performed.

What's actually selling for them — and running out?
Their #1 is on about $33.7K for the first half of September, estimated; one of their top three has sold through every size since Sep 24. Revenue predicted from their catalogue, prices and ads; stock read off their store.
Which ads are they scaling right now?
10 creatives — and on Sep 10 they launched new copies of 10 of them in one day. A brand adds copies of what it wants more of; that's the signal, not their spend.
Which of their posts actually broke out — and what did it do?
Every post against its own usual, the breakouts lit, and their followers over the readings after each. What followed a post, not proof it caused it.
When this competitor was my size, what did they do?
At your size they made four moves in six months — a first Meta push of fourteen try-on videos, a creator collab, mix-and-match sets, then an eighteen-piece resort range — and visits went from 75K to 117K (est.) over that stretch. Example values; what followed each move, not proof it caused it.
One swimwear brand you compete with, unnamed. Sales are estimates (Sep 1–14); stock is their store read on 8 days, Aug 20 – Sep 25; ad states are what they did, never results. Competitor analysis: example values on relative months, aligned by size, not date.
Estimated revenue for any Shopify store, and for every product in it.
| # | Product | Sales · Aug est ↓ | Orders est × price | Price · stock |
|---|---|---|---|---|
| 01 | 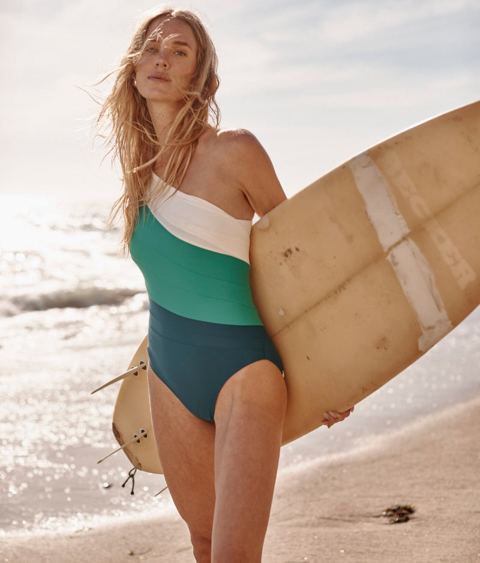 Sidestroke - Seaweed & Seaglass & White Sand | $78.9K | 631 × $125 | Steady11/13 sizes |
| 02 | 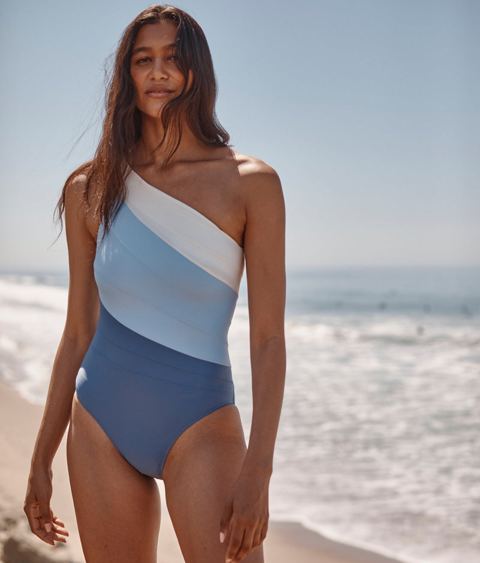 Sidestroke - Sky & Blue Mountain & White Sand | $38.8K | 310 × $125 | Steady7/13 sizes |
| 03 | 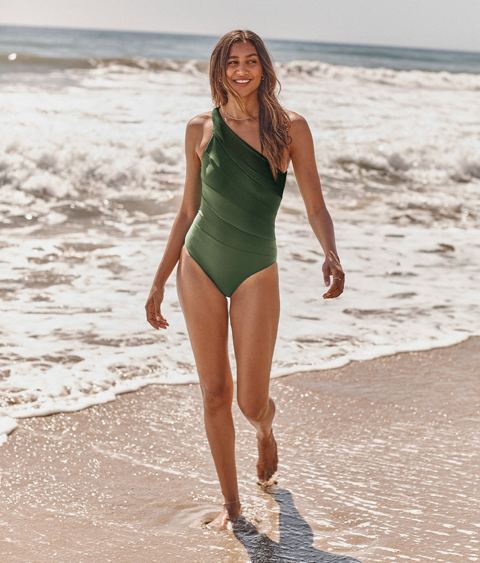 Sidestroke - Olive | $25.6K | 205 × $125 | Steady6/13 sizes |
| 04 | 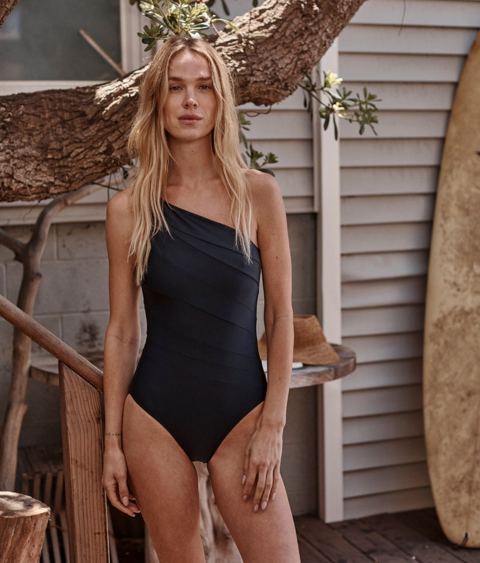 Sidestroke - Sea Urchin | $19.0K | 152 × $125 | Steady5/13 sizes |
| 05 | 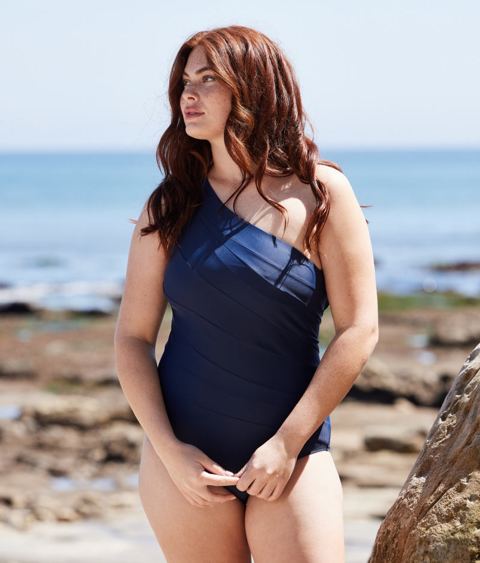 Sidestroke - Deep Sea | $15.2K | 121 × $125 | Steady5/13 sizes |
| 06 | 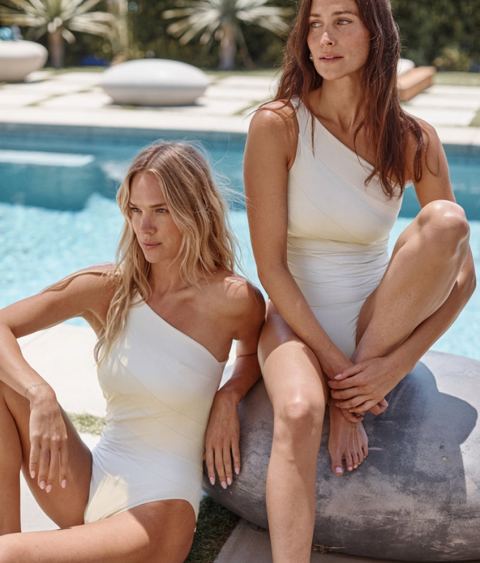 Sidestroke - White Sand | $12.6K | 101 × $125 | Steady |
| 07 | 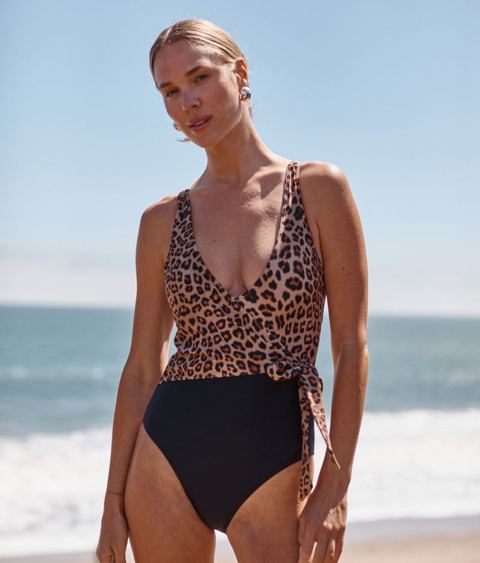 Perfect Wrap One-Piece - Leopard | $10.7K | 86 × $125 | Steady9/11 sizes |
| 08 | 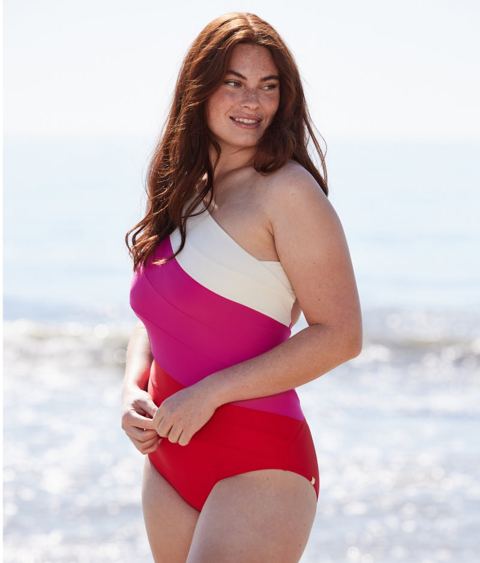 Sidestroke - Lava & Hibiscus & White Sand | $9.3K | 75 × $125 | Steady6/13 sizes |
| 09 | 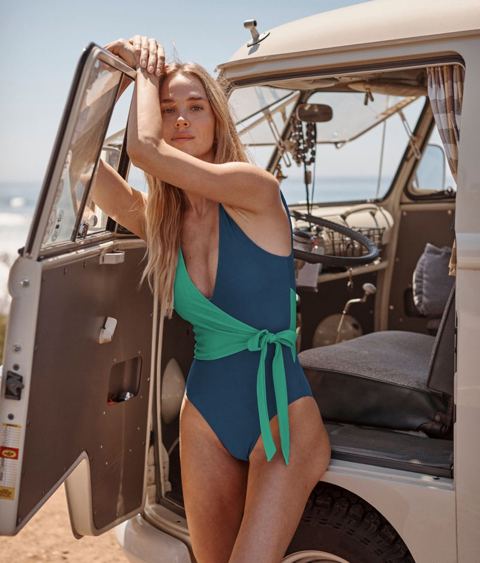 Perfect Wrap One-Piece - Seaglass & Seaweed | $8.3K | 66 × $125 | Steady5/11 sizes |
| 10 | 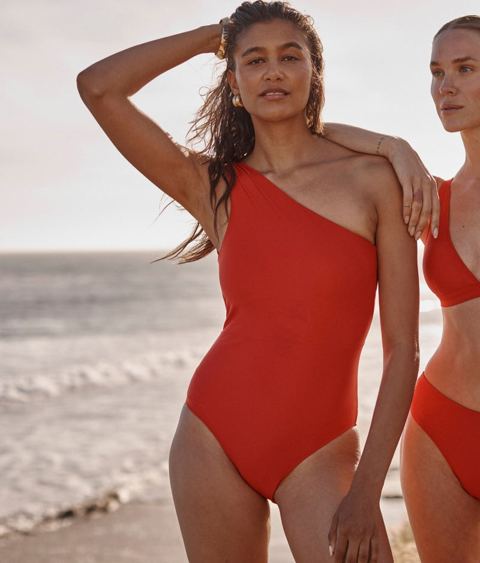 Ruched Sidestroke - Lava | $7.4K | 60 × $125 | Steady |
Watch their ads stop, one by one. Winning means the few they keep running, keep remaking and keep reusing — performance is never published. When they make a new version, you watch it land.









010 days
020 days
030 days
040 days
050 days
060 days
070 days
080 days
090 days
100 days
110 days
120 days
130 days
140 days
150 days
160 days
CPM
climbs
CTR
flattens
CPM climbs while CTR flattens — the creative has tired.

Starter for one. Growth for a team.
Your report, names hidden.
A small team sharing one workspace.
One operator watching a handful of rivals.
Prices in USD. Polar, our Merchant of Record, handles invoices and tax.
Need more than Growth? Book a call ↗
With Thomas, who builds ecvision. Bring the rivals you watch.
 Followers · their store

Get your competitors' winning creatives.
The follower panel from the app. One at a time, the posts that most beat their own usual lift out beside the chart, tied to the week they went up, while the two weeks after light up on the line.
+12,000 · +3.0% since Oct 6 · Axis fitted to the readings, not from zero · the tint after a post runs to the second weekly reading after it
1× = each item’s own usual · stems up above it, down below · accent: ≥ 2×
Usual (median) · 10.3K views over 343 posts · 104 of 343 posts at 2× or more, the 6 strongest marked